Indicator Progress
We all know the saying, "what gets measured, gets managed". The Green Directions Vaughan indicators tell us our sustainability story - they identify what's going well and where we need to focus our efforts.
In 2012, City of Vaughan Council approved 24 quantitative indicators to track progress. During the GDV renewal process, three indicators have been revised to allow for more accurate annual measurements and are intended to be up[dated on an annual basis. All other indicators are aligned with global and regional efforts to measure progress on sustainability including the World Council on City Data's (WCCD) ISO 37120: Sustainable Cities and Communities - Indicators for City Services and Quality of Life and the United Nations Sustainable Development Goals (SDGs).
Indicator Data Tracking
- Click here to see indicator data from 2011-2018 (Green Directions Vaughan).
- Click here to see indicator data from 2019 onwards (GDV 2019).
Indicators measured on an annual basis are listed below:
Energy
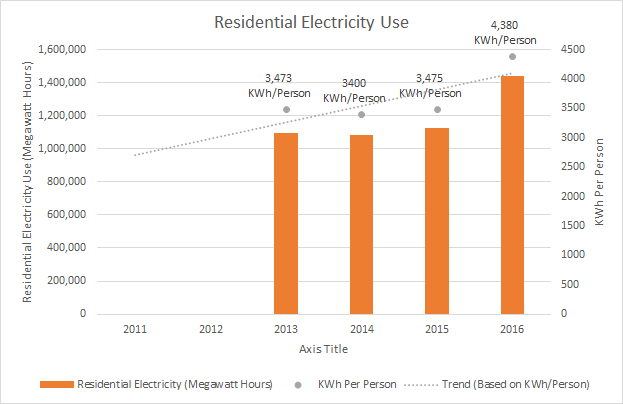
- Total residential electricity use per capita (Kilowatt hours per person)
- City of Vaughan buildings energy use (Kilowatt hours per 1,000 square feet)
Climate Change
- Total community greenhouse gas emissions (Tonnes of equivalent carbon dioxide emissions per year and per capital
- Corporate greenhouse gas emissions per resident served (Tonnes of equivalent carbon dioxide emissions per person per year)
Air Quality
- Particulate matter (PM2.5) (Particulate matter measured in micrograms per cubic metre)
- City fleet vehicles fuel consumption and greenhouse gas emissions (Litres of fossil fuel consumed and calculated equivalent greenhouse gas emissions)
- Number of days when Air Quality Index is poor (AQI is the number of days in which air quality is measured as “poor” for at least one hour)
Water Use
- Daily volume of water used per person in York Region (Litres per person per day)
Stormwater Management
- Water quality (Total Suspended Solids, number of SWM ponds cleaned, catch basin cleanouts, SWM ponds inspected)
Solid Waste
- Residential waste diverted from landfill (Proportion of waste diverted from landfill)
- Waste diverted from landfill in City facilities (Proportion of waste diverted from landfill)
Land Use
- Greenspace (Hectares per 1,000 people)
Urban Forest
- Number of trees planted annually by the City and through City-sponsored public events
Sustainable Built Form
- Building floor area certified under recognized green building programs (Floor space in square feet of buildings certified to LEED for New Construction standards and to BOMA BEST for annual certification)
Walking and Cycling Paths
- Length of walkways and cycling paths (Kilometres)
- Percentage of walkways and paths which are linked
Transit
- Transit passenger trips per person in York Region (Number of trips per person per year)
Economic Activity
- Level of construction activity (Value of building permits in millions of dollars)
- Ratio of population to jobs (Number of jobs)
- Number of jobs provided by Vaughan businesses (Number of jobs)
Active Community
- Total participant hours for recreation programs (Number of hours)
- Number of stakeholders involved in different community engagements (Count of interactions for social media, website and online newsletters)
Creative Community
- Number of cultural initiatives supported or endorsed by the City (Number of events and initiatives)
Engagement
- Number of environmentally related public outreach events held by the City and number of attendees at environmental events